Interpreting Profile Reports
Profile Reports are displayed in a table from which the results can be viewed, analyzed and merged. For example:
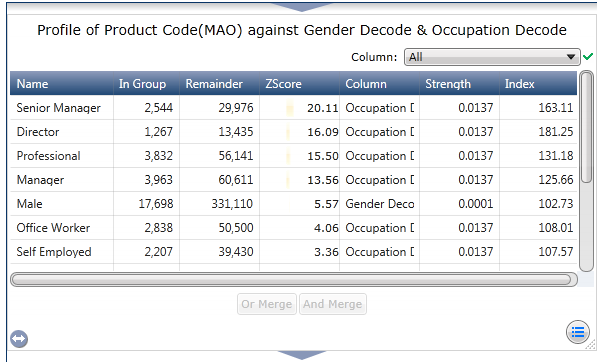
The Profile Report table columns headings are explained as follows:
| Column Name
|
Description
|
| Name
|
This is the name of the value in the attribute column. It could be a single attribute or a number of attributes where auto merging has been enabled. For example, the column 'Gender' includes the attributes '
Male ', '
Female ', and '
Unknown '.
|
| In Group
|
This is a count of the records that are common to both the target segment and that selected attribute.
|
| Remainder
|
This is an invert of the
In Group segment i.e. records that are not in the segment and do not have that attribute.
|
| ZScore
|
Sometimes called a
normalized index , this value indicates how far and in what direction each attribute differs from the mean. It is expressed in units of the standard deviation. The graphic presents the same information visually. The mean for the distribution is the centre line. The further to the right the bar goes, the more likely that attribute is to be shared with the target Segment. The further to the left the bar goes the less likely that attribute is to be shared with the target Segment.
|
| Column
|
This is the database column that the attribute value is derived from.
|
| Strength
|
Also called the 'Uncertainty Coefficient', this statistic measures the degree to which one categorical value contains information about another categorical value. For example, if knowing a person's gender could help us to predict if they would purchase product Y. It ranges in value from 0 to 1, with 0 meaning that knowing a persons gender would be no help in predicting a purchase, where a strength close to 1 means that knowing a person's gender means that you could be just about certain that they would buy product Y.
|
| Index
|
This the value of the proportion of records in the filtered group divided by the proportion of records in the unfiltered group.
|
|
|